13.1. Introduction to Tracing
Tracing is an important function which has several applications including identification of complex threading, detection of deadlocks, tracing functions along with their argument values, and return values through progression of several function calls and audit the performance of an application according to required specifications.
RTEMS tracing framework is under development and welcomes contribution by users.
RTEMS has the following trace components:
Common Trace Format Integration
RTEMS trace framework can currently function using the following methods. Both of the methods make use of the Trace Linker :
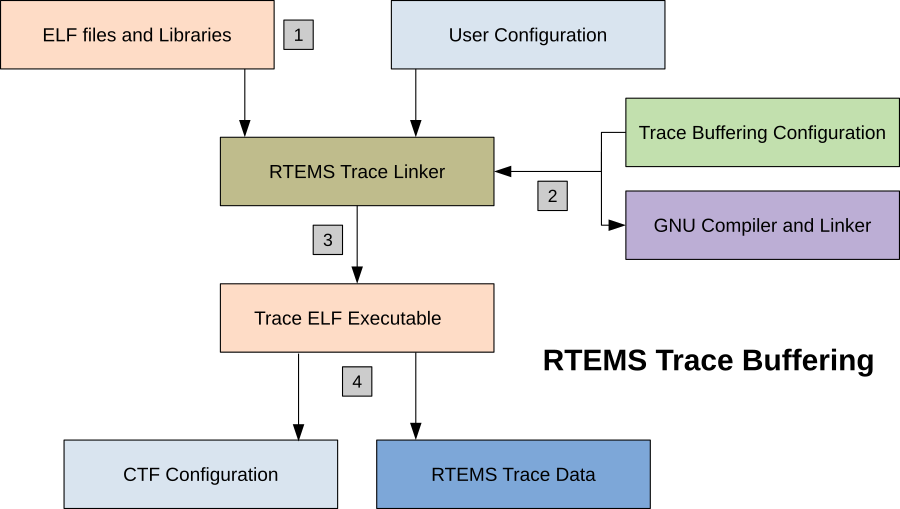
13.1.1. RTEMS Trace Using Trace Buffering
This scheme of tracing goes through the flow of events described in a subsequent flowchart:
Step 1: The user creates an application and user configuration file. The configuration file specifies the use of the trace buffer generator and other standard initializations. The user then configures their BSP and invokes the trace linker using a command to link the application executable. The trace linker uses the application files in compiled format (ELF) and the libraries used to build the application for performing this link.
Step 2: The RTEMS Trace Linker reads the user’s configuration file and that results in it reading the standard Trace Buffering Configuration files installed with the RTEMS Trace Linker. The trace linker uses the target compiler and linker to create the trace enabled application executable. It wraps the functions defined in the user’s configuration with code that captures trace records into the statically allocated buffer. The trace wrapper code is compiled with the target compiler and the resulting ELF object file is added to the standard link command line used to link the application and the application is re-linked using the wrapping option of the GNU linker.
Step 3: The trace linker creates an executable which is capable of running on the target hardware or simulator.
Step 4: RTEMS shell provides the “rtrace” command to display and save trace buffers.
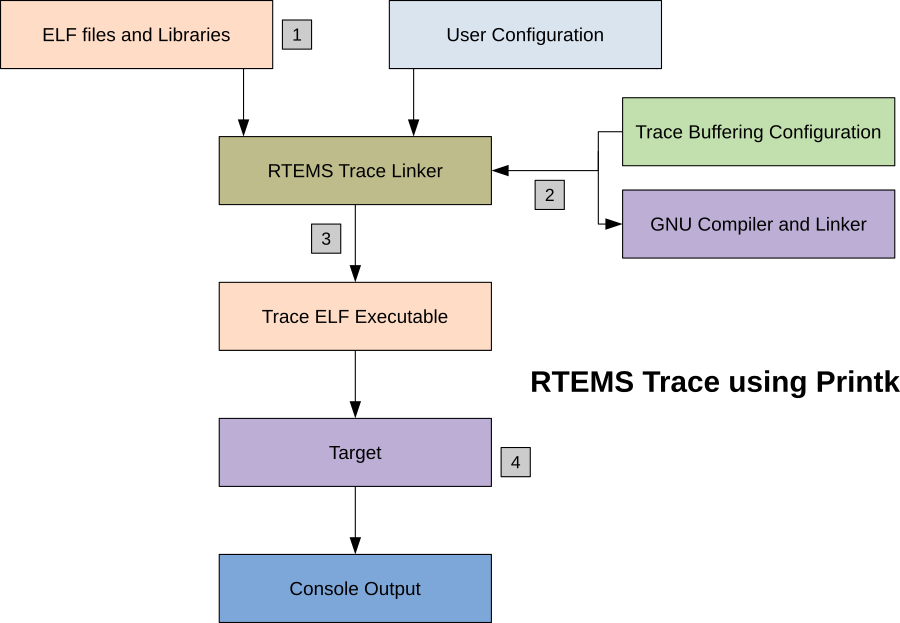
13.1.2. RTEMS Trace Using Printk
This scheme of tracing goes through the flow of events described in a subsequent flowchart:
Step 1: The user creates an RTEMS application in the normal manner as well as a Trace Linker configuration file. The configuration file specifies using the Printk trace mode and the functions to trace. The user invokes the Trace Linker with the configuration and the normal link command line used to the link the application executable. The application ELF object files and libraries, including the RTEMS libraries are standard and do not need to be built specially.
Step 2: The RTEMS Trace Linker reads the user’s configuration file and that results in it reading the standard Printk Trace Configuration files installed with the RTEMS Trace Linker. The trace linker uses the target compiler and linker to create the trace enabled application executable. It wraps the functions defined in the user’s configuration with code that prints the entry with arguments and exit and return value if any. The trace wrapper code is compiled with the target compiler and the resulting ELF object file is added to the standard link command line used to link the application and the application is relinked using the wrapping option of the GNU linker.
Step 3: The trace linker creates and RTEMS ELF executable that can be run on the target hardware or simulator.
Step 4: The application is run in the hardware directly or using a debugger. The printk() output appears on the target console and the user can save that to a file.
The Tracing Examples section describes generation of traces using Trace Buffering technique for the fileio testsuite available with RTEMS installation.