10.6. Debugging
An RTEMS executable is debugged by loading the code, data and read-only data into a target with a debugger connected. The debugger running on a host computer accesses the ELF file reading the debug information it contains.
The executable being debugged needs to be built with the compiler and linker debug options enabled. Debug information makes the ELF executable file large but it does not change the binary footprint of the executable when resident in the target. Target boot loaders and file conversion tools extract the binary code, data and read-only data to create the file embedded on the target.
An ELF executable built with debug information contains DWARF debug information. DWARF is a detailed description of the executable a debugger uses to locate functions, find data, understand the type and structure of a variable, and know how much entry code every call has. The debugger uses this information to set breaks points, step functions, step instructions, view the data and much more.
We recommend the compiler and linker debug options are always enabled. An ELF file with debug information can be used to investigate a crash report from a production system if the production ELF image is archived. The RTEMS tools chain provides tools that can take an address from a crash dump and find the corresponding instruction and source line. The extra size the debug information adds does not effect the target footprint and the extra size on a host is small compared to the benefits it brings.
A desktop or server operating system’s kernel hosts the executable being debugged handling the interaction with the executable and the debugger. The debugger knows how to communicate to the kernel to get the information it needs. Debugging an embedded executable needs an extra piece called an agent to connect the target to the debugger. The agent provides a standard remote interface to the debugger and an agent specific connection to the target.

Fig. 10.3 Embedded Executable Debugging
The RTEMS tool chain provides the GNU debugger GDB. GDB has a remote protocol that can run over networks using TCP and UDP protocols. The GDB remote protocol is available in a number of open source and commercial debugging solutions. Network debugging using the remote protocol helps setting up a laboratory, the targets can be remote from the developers desktop allowing for better control of the target hardware while avoiding the need to plug devices in to an expensive desktop or server machine.
The following are some examples of GDB and GDB server environments RTEMS supports.
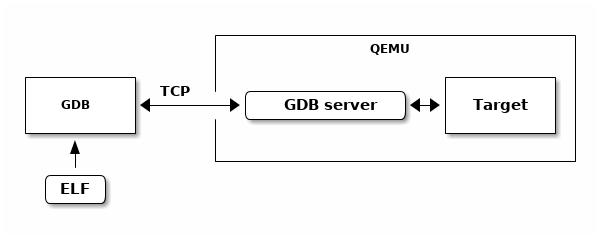
QEMU contains a debugging agent for the target being simulated. A QEMU command line option enables a GDB server and the simulator manages the interaction with the target processor and it’s memory and caches.

Fig. 10.4 QEMU Executable Debugging
OpenOCD is a JTAG debugging package that interfaces to a wide of JTAG pods. JTAG is a low level high speed serial interface modern processors provide as a means of controlling the core processing logic. The features available depend on the architecture and processor. Typical functions include:
Processor control and register access
System level register access to allow SOC initialization
General address space access
Cache and MMU control
Break and watch points

Fig. 10.5 OpenOCD JTAG Executable Debugging
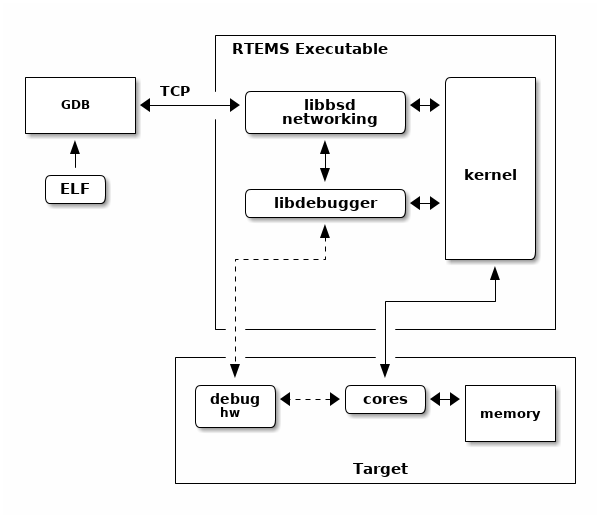
The RTEMS kernel has a debugging agent called libdebugger. This is a
software based agent that runs within RTEMS using network services to provide a
remote GDB protocol interface. A growing number of architectures are
supported. The RTEMS debugging agent is for application development providing
thread aware stop model debug experience.

Fig. 10.6 Libdebugger Executable Debugging